Cumulative frequency distribution
What is the cumulative frequency distribution? We find the cumulative frequency distribution for a class by adding the frequency of that class to the frequencies of all previous classes.
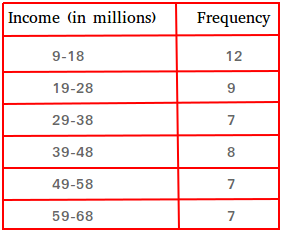
Take a look at the table below that shows the income of rich people.
The third class is 29-38. These are people whose income is at least 29 million and at the most 38 million.
The frequency of that class is 7. This means that the income of 7 people is at least 29 million and at the most 38 million.

What if you wanted to know about the number of people whose income is 38 million or less?
You are in this case looking for the cumulative frequency of 29-38.
Those who have an income of 38 million or less are those whose income is at least 9 million and at the most 38 million.
All you have to do then is to add 12, 9, and 7
The cumulative distribution of 29-38 is equal to 12 + 9 + 7 or 28.
The table below shows the cumulative frequency distribution for all the classes.
You can also compute the cumulative relative frequency using this formula.
Recall that the sum of all the frequencies is 50. For example, the cumulative relative frequency of 39-48 = 36/50 = 0.72
Here is the cumulative frequency distribution table

Ogives of a cumulative frequency distribution
An ogive is a line graph that shows the cumulative frequencies of the classes.
To graph an ogive, put the class boundaries along the x-axis.
To find the class boundary of a class, you will look for the number between the upper limit of that class and the lower limit of the next class.
For example, what are the class boundaries of 29-38?
To find the lower boundary, look for the number between 28 and 29
The number between 28 and 29 is 28.5, so the lower boundary is 28.5
To find the upper boundary, look for the number between 38 and 39
The number between 38 and 39 is 38.5, so the upper boundary is 38.5
- Notice though that the lower boundary of the first class is 8.5 (If there was a class before 9-18, the upper limit would be 8. The midpoint between 8 and 9 is 8.5)
- Notice also that the upper boundary of the last class is 68.5 (If there was a class after 59-68, the lower limit would be 69. The midpoint between 68 and 69 is 68.5)
Therefore, the boundaries are 8.5, 18.5, 28.5, 38.5, 48.5, 58.5, and 68.5
To graph an ogive, put all the class boundaries on the x-axis.
Make a dot above the upper boundary of each class. The height of the dot will be the same as the cumulative frequency of that class.
For example, the upper boundary of 39-48 is 48.5 and the cumulative frequency of 39-48 is 36 Make a dot above 48.5 that has a height of 36.
Connect all dots with a straight line.
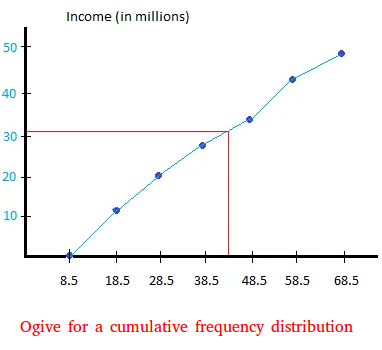
The ogive is shown below for the cumulative frequency above.

How to use the ogive to approximate the cumulative frequency of any interval
Let's say you want to find how many people earn 43.5 million or less.
43.5 million is between 38.5 and 48.5.
Just draw a line from the x-axis at 43.5 to the graph. The line will intersect the graph at a point.
From that point, draw a second line from the point of intersection to the y-axis.
The second line touches the y-axis at 32.
Therefore, you can say that 32 people earn 43.5 million or less.