Graph of a simple harmonic motion
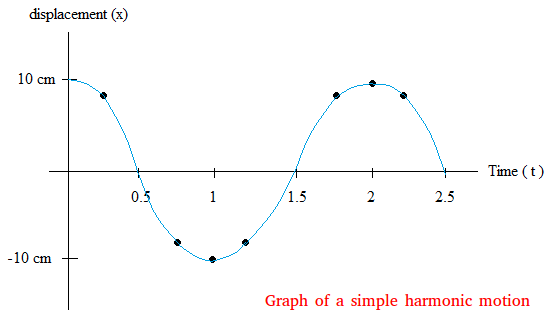
The graph of a simple harmonic motion is a sine curve. This lesson will show you a simple technique to plot such a graph.
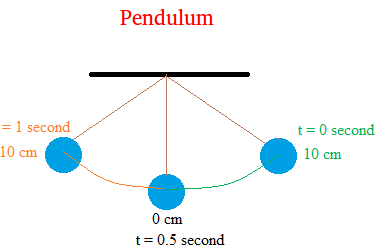
When using a pendulum, the sine curve is the result of graphing the position of the pendulum with respect to time.
The same result can be obtained if we attach a weight to a spring undergoing vertical movement.
We will use a pendulum to show and explain why we get a sine curve.
Pretend you want to perform an experiment with a pendulum. Your experiment include measuring different positions of the pendulum and the time it takes to reach these positions.
You may end up with the following data shown in the graph below.

Here is what you did to end up with the data above. You pull the pendulum to the right until it reaches a maximum displacement of 10 cm and then released the pendulum so it can oscillate or move back and forth.
At t = 0 second which is the time before release, the position of the pendulum is 10 cm.
You realize that it takes 2 seconds to reach a maximum height of -10 cm on the left side of the equilibrium point.
And another 1 second to go back where it started. This means that the period is 2 seconds (T = 2 seconds).
Notice that at 0 cm, the pendulum has reached its equilibrium point.
Notice also that for the position of the pendulum, anything on the right of 0 cm is positive and anything on the left of 0 cm is negative.
With some more experiments, patience and a good stopwatch, you may end up with some more data
Time Displacement
0 s 10 cm
0.5 s 0 cm
0.75 s -8 cm
1 s -10 cm
1.25 s -8 cm
1.5 s 0 cm
1.75 s 8 cm
2 s 10 cm
2.25 s 8 cm
2.5 s 0 cm
Here is the graph of a simple harmonic motion

As you can see, the graph of a simple harmonic motion is a sine curve. If you repeated the
experiment with a weight suspended on a spring and allow the spring to
oscillate, you will end up with a similar sine curve. A sine curve is
what you get for simple harmonic motion.
Frank Oppenheimer demonstrated that a pendulum swinging back and forth traces out a sine curve when a surface beneath the pendulum moves at constant speed.