Graph points in three dimensions
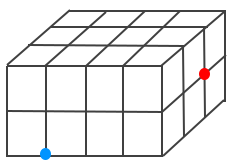
When you graph points in three dimensions, you are using a coordinate space as opposed to a Cartesian coordinate system. You are in fact graphing or plotting points in space. Take a look at the figure below to see what points look like in space.

To go from the blue point to the red point, you could to do the followings although there are other choices.
1. Move to the right three units
2. Move backward two units
3. Move up 1 unit
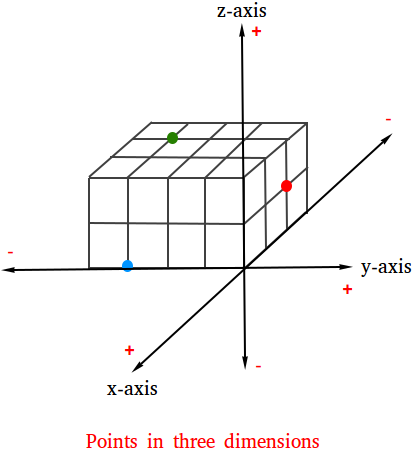
You have learned to graph on an xy-coordinate plane using ordered pairs. However, you need a third axis, called z-axis, to move from the blue point to the red point. This third axis turns the xy-coordinate into a coordinate space. Now, let us put some axes to see what a coordinate space looks like.

Take a close look at the coordinate space in order to see where the coordinates are positive or negative.
It is also important to notice the followings when you go from the blue dot to the red dots.
- When you move to the right three units, you are moving along the y-axis.
- When you move backward two units, you are moving along the x-axis.
- When you move up 1 unit, you are moving along the z-axis.
Coordinate of the 3 points above
Coordinate of the red point is (x, y, z) = (-2, 0, 1)
Coordinate of the green point is (x, y, z) = (-2, -3, 2)
Coordinate of the blue point is (x, y, z) = (0 -3, 0)