Graphing Inequalities
Graphing inequalities is what this lesson will teach you. It may help to remind you what an inequality is before showing how to graph it. An inequality is basically any mathematical statement that uses greater than (>), less than (<), less than or equal (≤), greater than or equal (≥), or not equal (≠) symbol. For example, the statements x > 6 and x ≤ -5 are examples of inequalities.Graphing inequalities
Explore
Quick reference
- > or < — open circle, the boundary number is not a solution.
- ≥ or ≤ — closed (filled) circle, the boundary number is included.
- ≠ — open circle, shade both directions (two rays, one point excluded).
- Shade toward the values that make the statement true: right for "greater than", left for "less than".
Practice
x > 2
Score: 0 / 0
Graphing inequalities with five carefully chosen examples
Example #1
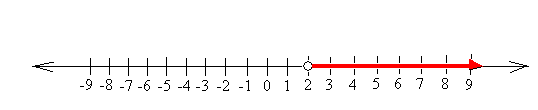
Graph x > 2
Draw a non-shaded or open circle at 2 and shade everything on the right of 2.
The shaded area in red is your solution. It means that the solution can be any number on the right of 2.
Notice that 2 is not shaded because 2 is not included in your solution. Notice also that although the last number on the number line is 9, your solution does not stop at 9.
 |
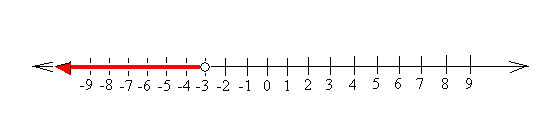
Graph x < -3
Draw an open circle at -3 and shade everything on the left of -3. Notice again that -3 is not shaded because -3 is not included in your solution. Notice again that although the last number on the number line is -9, your solution does not stop at -9.
 |
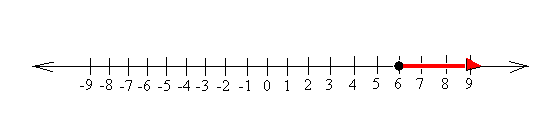
Graph x ≥ 6
Draw a shaded circle at 6 and then shade everything on the right of 6. Notice that this time, the circle is shaded because x is also equal to 6.
 |
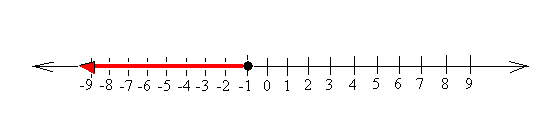
Graph x ≤ -1
Draw a shaded circle at -1 and then shade everything on the left of -1. Notice again that the circle is shaded because x is also equal to -1.
 |
Graph x ≠ 2
x ≠ 2 means that x is equal to any number except 2.
Draw a circle at 2 and shade everything on the right and on the left of 2.
 |
You can also write x ≠ 2 as x > 2 or x < 2. Notice the use of the word "or" instead of "and". We could not use "and" because x cannot be bigger than 2 and be smaller than 2 at the same time.