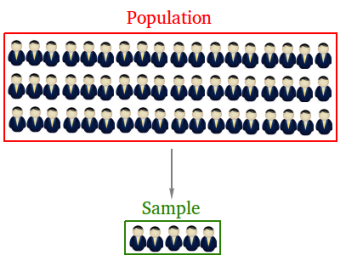
Population distribution
The population distribution is the probability distribution using all elements of a population.

Suppose there are 5 students in a math class and their scores on the final exam are the followings:
80 85 85 90 92
Notice that we are only using 5 scores! Nonetheless, the 5 scores above are the scores for the population since we are using all 5 scores.
A population does not need to have 10,000,000 items in order for it to be called a population! It could have just 5 items as long we use all the elements.
Calculating the population distribution for the 5 scores above
Let x be the score of a student. We can make a frequency distribution table of scores as shown in the table below.
| x | f | Relative Frequency |
| 80 | 1 | 1/5 = 0.20 |
| 85 | 2 | 2/5 = 0.40 |
| 90 | 1 | 1/5 = 0.20 |
| 92 | 1 | 1/5 = 0.20 |
| 5 | Sum = 1 |
Here is the population probability distribution
| x | P(x) |
| 80 | 0.20 |
| 85 | 0.40 |
| 90 | 0.20 |
| 92 | 0.20 |
| ΣP(x) =1 |
Calculating the mean using the population probability distribution
μ = ΣxP(x) = 80 × 0.20 + 85 × 0.40 + 90 × 0.20 + 92 × 0.20 = 86.4
μ is a population parameter and it gives the average grade for the population distribution.
The value of μ or 86.4 is fixed or constant. In other words, there is only 1 value of the population mean.
The value of the standard deviation, which we do not compute here is also fixed or constant.