Raw data
Recommended Lessons
Not sure where to start? These are the lessons and games we recommend most to students, parents and teachers on Basic-mathematics.com. Each lesson explains the topic in plain language, walks you through worked examples step by step, and ends with practice so you can check your understanding. Pick one below, or use the menu to find lessons on fractions, algebra, geometry, statistics and more.
What is raw data in statistics? After data have been collected from members of a sample or population, the information is recorded in the sequence in which it is given.
Such data are called raw data. If the information collected has only numerical values, the raw data are called quantitative raw data.
If the information collected has only non-numerical values, the raw data are called qualitative raw data or ungrouped data.
Let's say you want to do some research on the number of smartphones owned per family. Suppose you choose a sample of 50 families to do your research.

Suppose you call randomly 50 families across the country, ask them how many smartphones they own, and record the information in the sequence it is given to you.
The above is an example of quantitative raw data of this situation. The way you see the information in the table is the way you wrote it down on a piece of paper.
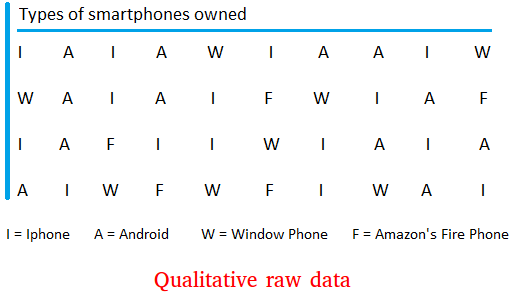
Suppose instead of focusing on the number of smartphones owned, you focus your study on the type of smartphone owned.
Type of smartphone may include Iphone, Android, Window Phone, and Amazon's Fire Phone.
To simplify things here, we will use I for Iphone, A for Android, W for Window Phone, and F for Amazon's fire Phone.
The procedure could to be to call people, ask them about the type of smartphone they carry, and write down what they tell you on paper.
After you have asked 40 people, you could end up with the following qualitative raw data. The table below shows the data for 40 items.