Sample space diagram
A sample space diagram is a diagram used to describe a sample space. But what is a sample space? A concrete example will make it easy to understand.
Suppose you toss a coin twice. The result is shown below.
HH
HT
TH
TT
The terms below in bold are important terms that you need to understand since they will be used often in this unit and in general in statistics.
Experiment:
The experiment is ' toss a coin twice '
Other examples of experiment
Roll a die once
Take a test
Draw a card
Outcomes:
The outcome of tossing a coin twice is HH, HT, TH, and TT
Sample Space
The sample space of tossing a coin twice is
s = { HH, HT, TH, TT }
Notice the use of brackets to describe the sample space.
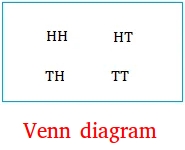
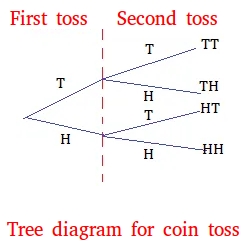
Sample space diagram of tossing a coin twice.
You could describe the sample space above with either a Venn diagram or a tree diagram.
A Venn diagram is a closed figure such as a circle or a rectangle that is used to show all possible outcomes of an experiment.
In a tree diagram, each branch of the tree represents 1 outcome.
Below, we show two sample space diagrams of tossing a coin twice.

