Standard Deviation
The standard deviation (SD) tells how close or far the values of a data set are from the mean.

To see what we mean by "how close or far to the mean", consider the following data showing the grades of 5 students.
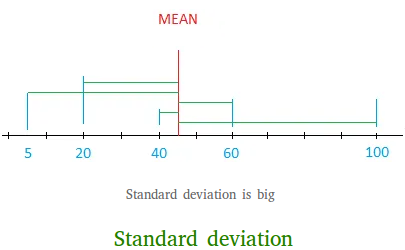
5 20 40 60 100
If you computed the mean and the SD for this data set, you will find that the mean is 45 and the SD is about 37.
The graph above shows the deviations from the mean. As you can see, many of the deviations shown with green lines are big.
If the standard deviation is big, the values are, on average, far from the mean.
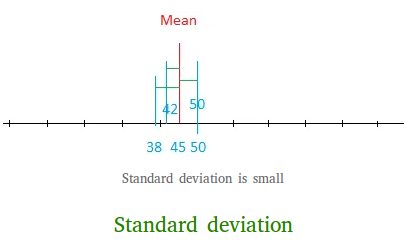
On the other hand, if the standard deviation is small, the values are, on average, close to the mean.
This means that some grades, on average, are far from the mean, either below or above.
However, consider this time the following grades.
42 45 50 38 50
This time, the mean is again 45, but the SD is only 5.2
The deviations are small this time.

How to calculate the standard deviation
Since the standard deviation tries to find how far the values deviate from the mean, it makes sense to calculate the deviations from the mean for all the values.
Let us see how the standard deviation was found for the grades below.
42 45 50 38 50
To obtain the deviation from the mean for a single value, just subtract the mean from that value.
The mean is 45.
42 - 45 = -3
45 - 45 = 0
50 - 45 = 5
38 - 45 = -7
50 - 45 = 5
It makes sense also to add -3, 0, 5, -7, and 5 together and then divide the result by 4 to get the "average" standard deviation.
However, notice that -3 + 0 + 5 + -7 + 5 = 0 and 0 divided by 4 = 0. Furthermore, since there are 5 numbers, why do we divide by 4 instead of 5? Keep reading to see the explanations!
We don't get anything useful by adding -3, 0, 5, -7, and 5. To avoid getting 0, we can square the values before adding them.
(-3)2 = 9
(0)2 = 0
(5)2 = 25
(-7)2 = 49
(5)2 = 25
9 + 0 + 25 + 49 + 25 = 108
Dividing 108 by 4 gives the variance or sample variance.
Variance = 108/4 = 27
Since we had to square all the values to avoid getting zero, we need to take the square root of 27 to get the standard deviation.
Standard deviation = square root of 27 = 5.19 or 5.20
How to derive the standard deviation formula
To find the formula for standard deviation, we just need to generalize what we did above. Here are the steps.
Step #1:
Find the mean or xStep #2:
Subtract the mean from the values. Let x represent all the values and x the mean.
We get x - x
Step #3:
Square each of the differences we found in step #2.(x - x)2
Step #4:
Add all the squares you found in step #3
Σ(x - x)2Step # 5:
Let n be the number of value. Recall that in our example above, we divided by 4 instead of 5.
If n is the number of values, divide the sum above by n - 1. We call this the variance.
Now, why is the denominator n - 1 instead of n?
- The main reason that we look for the sample variance is to estimate the population variance. It has been observed that when the denominator is n - 1, it does a better job estimating the population variance.
- Division by n tends to underestimate the population variance. In other words when dividing by n, it tends to make the population variance smaller than it actually is.
Step # 6:
Recall that in step #3 we had to square the differences. Therefore, we need to take the square root of the variance to get the standard deviation.
$$ Sample \ standard \ deviation = s = \sqrt {\frac{Σ(x - \bar x)^{2}} {n - 1} } $$$$ Population \ standard \ deviation = σ = \sqrt {\frac{Σ(x - µ)^{2}} {N} } $$