What Is Statistics? Definition and Examples
What is statistics? The word statistics can mean two different things. First, take a close look at the figure below.
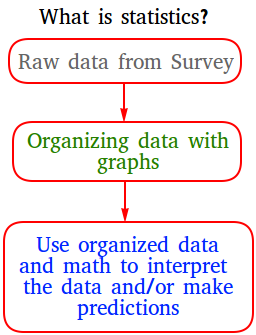
In this lesson, you will learn
- the two definitions of the word statistics, with examples
- the five things statistics does with data: collect, organize, analyze, present and interpret
- the difference between applied and theoretical statistics, and between an educated guess and a pure guess
- the meaning of population, sample, parameter and statistic
What Is Statistics? Definition #1: Numerical Facts
Statistics may refer to numerical facts or raw data after a survey was conducted.
Find below some examples of statistics according to definition #1:
- Number of students who graduate from high school in the United States.
- Number of students who graduate from college in the state of Massachusetts.
- Number of people who visit a doctor daily.
- Number of marriages that end in divorce.
- Unemployment figures.
For example, saying that more than 3 million students graduate from high school each year in the USA is an example of statistics.
Which sentence uses statistics in the sense of definition #1? (a) “Statistics is my favorite class.” (b) “12 of the 30 students in our class walk to school.”
Show answer
Sentence (b). It gives a numerical fact about the class. Sentence (a) talks about statistics as a subject, which is definition #2.
Second, statistics may refer to the field of study. In this sense, we can define statistics as follows.
What Is Statistics? Definition #2: The Field of Study
Statistics may refer to a collection of methods that are used for collecting, organizing, analyzing, presenting, and interpreting data.
The five words in this definition are the five steps of a statistical study. Here is what each step means:
- Collect: gather the data, for example with a survey. The answers, in the order you get them, are the raw data.
- Organize: put the data in order and count how often each value appears in a frequency table.
- Analyze: calculate numbers that describe the data, such as the mean, the median, the mode and the range.
- Present: show the data in a table or a graph, such as a bar graph.
- Interpret: explain what the numbers and the graph tell you and draw a conclusion.
- Collect: the raw data are 0, 1, 2, 1, 0, 3, 1, 2, 1, 4.
- Organize: in order, the data are 0, 0, 1, 1, 1, 1, 2, 2, 3, 4. The answer 0 appears 2 times, 1 appears 4 times, 2 appears 2 times, and 3 and 4 appear once each.
- Analyze: the mean is 15 ÷ 10 = 1.5, the median is (1 + 1) ÷ 2 = 1, the mode is 1, and the range is 4 − 0 = 4.
- Present: draw a bar graph with the answers 0 to 4 along the bottom and their frequencies as the heights of the bars.
- Interpret: on average, these students have 1.5 pets. Half of them have 1 pet or fewer, and the most common answer is 1 pet.
The mean is 1.5 pets, the median is 1 pet, the mode is 1 pet and the range is 4 pets.
A student draws a bar graph of her survey results. Which of the five steps is she doing?
Show answer
Present. Showing the data in a table or a graph is the present step.
Statistics in Action: Try the Five Steps
Pick a survey, ask 10 new people, or type your own data. Every step updates right away, so you can see what statistics does with the data.
- 1. Collect
- 2. Organize
- 3. Analyze
- 4. Present
- 5. Interpret
Finding the median without putting the data in order first. In the raw data 0, 1, 2, 1, 0, 3, 1, 2, 1, 4, the two middle values are 0 and 3, which would give a median of 1.5. In order, the two middle values are 1 and 1, so the median is 1.
Find the mean of the data 2, 5, 5, 7, 11.
Show answer
6. Add the data: 2 + 5 + 5 + 7 + 11 = 30. Divide by 5: 30 ÷ 5 = 6.
Statistics Has Two Aspects: Theoretical and Applied
Applied statistics involves using formulas, theorems, and laws to solve real-world problems.
Mathematical or theoretical statistics deals with the development of formulas, theorems, and laws. Furthermore, the goal is to prove that these formulas, theorems, and laws are indeed correct.
Decisions made with the use of statistical methods are called educated guesses. On the other hand, when a decision is made without the use of statistical methods, we call these pure guesses. And of course pure guesses are often not reliable.
This unit about statistics will mostly teach you applied statistics. The goal of the lessons is to help you think statistically and be able to make some good educated guesses.
Before choosing a date for an outdoor party, Ana looks at the weather records for that week over the last 30 years. Is her choice an educated guess or a pure guess?
Show answer
An educated guess. She uses data to make her decision. Picking a date without looking at any information would be a pure guess.
Key Words in Statistics: Population, Sample, Parameter and Statistic
You will meet these four words in almost every statistics lesson. A population is the set of all elements in a statistical study. It can be people or things, such as all the students in a school or all the cars sold in a country. A sample is the part of the population that you actually study, because you often cannot reach every member of the population.
- ParameterA number, such as the mean, median or range, that describes a whole population.
- StatisticThe same kind of number, but found from a sample of the population.
- Descriptive statisticsOrganizes and shows data with tables, graphs, and measures such as the mean and the range.
- Inferential statisticsUses a sample to draw conclusions about the whole population.
Calling every mean a statistic. After 5,000 students take a state test, the mean score of all 5,000 students is a parameter, because it describes the whole population. The mean score of a sample of 100 of those students is a statistic.
To learn more, see the difference between population and sample, parameter vs statistic and types of statistics.
A town has 20,000 voters. A newspaper asks 400 of them how they will vote. What is the sample?
Show answer
The 400 voters who are asked. The population is all 20,000 voters in the town.
What You Will Learn in These Statistics Lessons
This unit follows the five steps above. Each group of lessons starts with the lesson below.
Data and variables
The kinds of data you collect, such as numbers and categories.
Population and sampling
How to choose a sample that represents the population.
Frequency distributions
How to organize data in frequency tables.
Measures of central tendency
The mean, median and mode: the center of the data.
Measures of dispersion
The range and the standard deviation: how spread out the data are.
Graphs of data
Histograms, bar graphs, box-and-whisker plots and stem-and-leaf plots.
Probability
How likely an event is, and how to count outcomes.
The normal distribution
The bell-shaped curve and z-scores.
Summary
- Statistics can mean numerical facts or raw data, such as the number of students who graduate each year.
- Statistics is also the field of study that collects, organizes, analyzes, presents and interprets data.
- Applied statistics uses formulas, theorems and laws to solve real-world problems. Theoretical statistics develops them and proves they are correct.
- Decisions made with statistical methods are educated guesses; decisions made without them are pure guesses.
- A population is the set of all elements in a study, and a sample is the part you actually study. A number about a population is a parameter; a number about a sample is a statistic.
Test Yourself: Interactive 10-Question Quiz
Now check what you learned. Every answer is explained, and each time you play you get new questions.
Quiz complete!