Difference Between Discrete and Continuous Data
In this lesson, you will learn
- what discrete data and continuous data are
- how to tell if numbers between two data values make sense
- why the points of discrete data are not connected on a graph
- why the points of continuous data can be joined by a line
What Is the Difference Between Discrete and Continuous Data?
Discrete data usually involve counting a number of items, such as the number of books, computers, people, and so forth.
Continuous data are data where numbers between any two data values make sense.
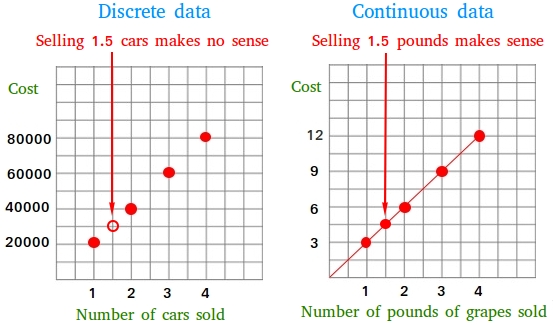
The figure below may help you understand the difference between discrete and continuous data. If not, keep reading!
Is the number of students in a class discrete or continuous data?
Show answer
Discrete. You count students, and 24.5 students makes no sense.
Discrete Data: The Cost of Producing Cars
For discrete data, numbers between two data values will make no sense. For example, suppose that the cost of producing a car is 20,000 dollars. This situation will give discrete data only since you cannot produce half of a car, three-fourths of a car or two and a half cars.
The table below shows the costs of producing 1, 2, 3, or 4 cars.
| Number of cars | Cost | Point |
|---|---|---|
| 1 | 20,000 | (1, 20000) |
| 2 | 40,000 | (2, 40000) |
| 3 | 60,000 | (3, 60000) |
| 4 | 80,000 | (4, 80000) |
If the company could produce 1.5 cars, it will cost 30,000. However, there is no such thing as 1.5 cars. The figure below shows what the graph of discrete data will look like for the table immediately above.
Notice that we cannot connect the points since the numbers between 1 and 2, 2 and 3, 3 and 4 do not exist.

Joining the points of discrete data with a line. A line would show values such as 1.5 cars, which don't exist. Leave the points separate.
Using the same cost of 20,000 dollars per car, what is the cost of producing 5 cars?
Show answer
100,000 dollars. 5 × 20,000 = 100,000, so the point (5, 100000) would be the next dot on the graph.
Continuous Data: The Cost of Grapes
On the other hand, continuous data can have numbers between any two data values that make sense. Suppose the cost of grapes is 3 dollars per pound. The number of pounds you buy could be 1, 1.5, 2, 3, 3.5, 4, …
Notice that 1.5 is a number between 1 and 2. By the same token, 3.5 is a number between 3 and 4. You do not have to buy exactly 1, 2, 3, 4, or 5 pounds, etc.
Here is what the graph of continuous data will look like.
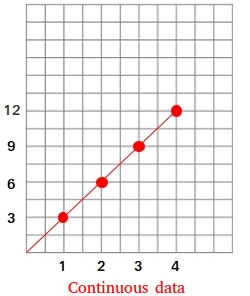
In the graph above, we show the points (1, 3), (2, 6), (3, 9), and (4, 12). (3, 9) of course means that 3 pounds cost 9 dollars. Notice how any number of pounds could be chosen between 0 and 1, 1 and 2, 2 and 3, 3 and 4.
Discrete data: plot separate points. Continuous data: the points can be joined, because every value in between makes sense.
- 2.5 pounds makes sense, because grapes are continuous data.
- Multiply the number of pounds by the price per pound: 2.5 × 3 = 7.5.
- The point (2.5, 7.5) lies on the line, halfway between (2, 6) and (3, 9).
2.5 pounds cost 7.50 dollars.
Is the time it takes to run 100 meters discrete or continuous data?
Show answer
Continuous. A time such as 14.37 seconds makes sense, so numbers between any two times make sense.
Summary
- Discrete data usually come from counting items, such as books, computers or people.
- For discrete data, numbers between two data values make no sense: there is no 1.5 cars.
- For continuous data, numbers between any two data values make sense: 1.5 pounds of grapes is fine.
- On a graph, discrete data are separate points; continuous data can be joined by a line.
Test Yourself: Interactive 10-Question Quiz
Now check what you learned. Every answer is explained, and each time you play you get new questions.
Quiz Complete! 🎉