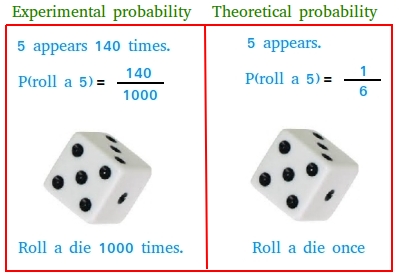
Experimental probability
Experimental probability (EP), also called empirical probability or relative frequency, is probability based on data collected from repeated trials.
Experimental probability formula
Let n represent the total number of trials or the number of times an experiment is done. Let p represent the number of times an event occurred while performing this experiment n times.
Example #1: A manufacturer makes 50,000 cell phones every month. After inspecting 1000 phones, the manufacturer found that 20 phones are defective. What is the probability that you will buy a phone that is defective? Predict how many phones will be defective next month.
The total number of times the experiment is conducted is n = 1000
The number of times an event occurred is p = 20
The probability that you will buy a defective phone is 2%
Number of defective phones next month = 2% × 50000
Number of defective phones next month = 0.02 × 50000
Number of defective phones next month = 1000
Experimental probability is performed when authorities want to know how the public feels about a matter. Since it is not possible to ask every single person in the country, they may conduct a survey by asking a sample of the entire population. This is called population sampling. Example #2 is an example of this situation.
Example #2
There are about 319 million people living in the USA. Pretend that a survey of 1 million people revealed that 300,000 people think that all cars should be electric. What is the probability that someone chosen randomly does not like electric car? How many people like electric cars?
Notice that the number of people who do not like electric cars is 1000000 - 300000 = 700000
The probability that someone chosen randomly does not like electric car is 70%
Let x be the number of people who love electric cars
x = 0.3 × 319 million
x = 95.7 million
The number of people who love electric cars is 95.7 million
Difference between experimental probability and theoretical probability

You can argue the same thing using a die, a coin, and a spinner. We will though use a coin and a spinner to help you see the difference.
Using a coin
In theoretical probability, we say that "each outcome is equally likely " without the actual experiment. For instance, without flipping a coin, you know that the outcome could either be heads or tails. If the coin is not altered, we argue that each outcome (heads or tails) is equally likely. In other words, we are saying that in theory or (supposition, conjecture, speculation, assumption, educated guess) the probability to get heads is 50% or the probability to get tails in 50%. Since you did not actually flip the coin, you are making an assumption based on logic.
The logic is that there are 2 possible outcomes and since you are choosing 1 of the 2 outcomes, the probability is 1/2 or 50%. This is theoretical probability or guessing probability or probability based on assumption.
In the example above about flipping a coin, suppose you are looking for the probability to get a head.
Then, the number of favorable outcomes is 1 and the number of possible outcomes is 2.
In experimental probability, we want to take the guess work out of the picture, by doing the experiment to see how many times heads or teals will come up. If you flip a coin 1000 times, you might realize that it landed on heads only 400 times. In this case, the probability to get heads is only 40%.
Your experiment may not even show tails until after the 4th flip and yet in the end you ended up with more tails than heads.
If you repeat the experiment another day, you may find a completely different result. May be this time the number of heads is 600 and the number of tails is 400.
Using a spinner
Suppose a spinner has four equal-sized sections that are red, green, black, and yellow.
In theoretical probability, you will not spin the spinner. Instead, you will say that the probability to get green is one-fourth or 25%. Why 25%? The total number of outcomes is 4 and the number of favorable outcomes is 1.
1/4 = 0.25 = 25%
However, in experimental probability, you may decide to spin the spinner 50 times or even more to see how many times you will get each color.
Suppose you spin the spinner 50 times. It is quite possible that you may end up with the result shown below:
Red: 10
Green: 15
Black: 5
Yellow: 20
Now, the probability to get green is 15/50 = 0.3 = 30%
As you can see, experimental probability is based more on facts, data collected, experiment or research!