Graph of the absolute value of x
The graph of the absolute value of x is called parent absolute value function. The reason it is given this name is because the absolute value of x is the easiest of all absolute value functions to graph.
The general form of an absolute value function is f(x) = |mx + b| + c
The vertex of the graph is (-b / m, c)
Using f(x) = |x| we see that, m = 1, b = 0, and c = 0
You can graph the absolute value of x by looking for the vertex and several other selected points.
First, find the vertex.
The vertex is located at (-b / m , c)
Therefore, the vertex is (-0 / 1, 0) or (0,0)
Now, evaluate the function for several selected values of x.
f(1) = |1| = 1
The point is (1,1)
f(-1) = |-1| = 1
The point is (-1,1)
f(2) = |2| = 2
The point is (2,2)
f(-2) = |-2| = 2
The point is (-2,2)
f(3) = |3| = 3
The point is (3,3)
f(-3) = |-3| = 3
The point is (-3,3)
Now, graph the following 7 points: (0,0), (1,1), (-1,1), (2,2), (-2,2), (3,3), and (-3,3)
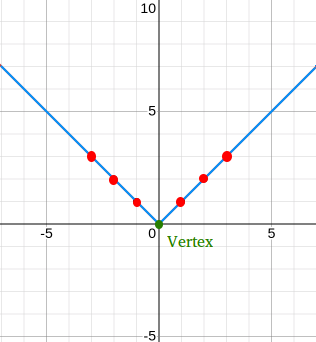
Things to notice about the graph of the absolute value of x
- The angle at the vertex is a right angle.
- The graph is symmetric about the y-axis.
- The linear "piece" on the right side of the y-axis has a slope of 1 and the linear "piece" on the left side of the y-axis has a slope of -1.
- The graph is located on both sides of the y-axis, so the domain is all real numbers or (-∞, ∞)
- The graph is located above the x-axis with the exception of the point (0,0), so the range is all non-negative real numbers or [0, ∞)