Graph an absolute value function
Recommended Lessons
Not sure where to start? These are the lessons and games we recommend most to students, parents and teachers on Basic-mathematics.com. Each lesson explains the topic in plain language, walks you through worked examples step by step, and ends with practice so you can check your understanding. Pick one below, or use the menu to find lessons on fractions, algebra, geometry, statistics and more.
You can quickly graph an absolute value function using the vertex and a table of values.
Note that the vertex is the sharp corner of the graph!
Example #1
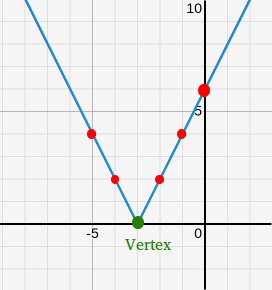
Graph f(x) = |2x + 6|
The general form of the function is f(x) = |mx + b| + c
Using f(x) = |2x + 6|, m = 2, b = 6, and c = 0
First, find the vertex.
As seen in the lesson about absolute value function, the vertex is located at (-b / m, c)
Therefore, the vertex is (-6 / 2, 0) or (-3, 0)
Now, evaluate the function for several selected values of x.
| x | -5 | -4 | -2 | -1 | 0 |
| f(x) | 4 | 2 | 2 | 4 | 6 |
The graph of the absolute value function is shown below
Example #2
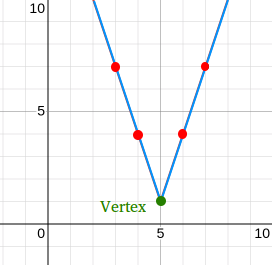
Graph f(x) = |-3x + 15| + 1
The general form of the function is f(x) = |mx + b| + c
Using f(x) = |-3x + 15| + 1, m = -3, b = 15, and c = 1
First, find the vertex.
The vertex is located at (-b / m, c) or (-15 / -3, 1) or (5, 1)
The vertex is (-6 / 2, 0) or (-3, 0)
Now, evaluate the function for several selected values of x.
| x | 3 | 4 | 6 | 7 |
| f(x) | 7 | 4 | 4 | 7 |
The graph of the absolute value function is shown below