Wave description
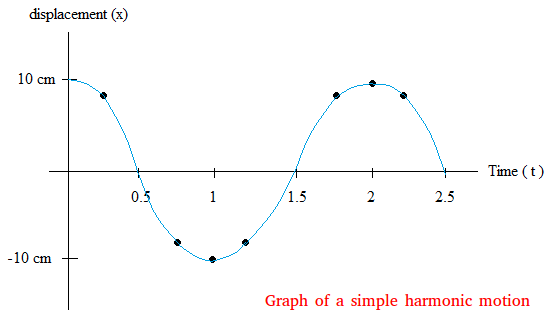
A sine curve is what we use to represent a wave. The sine curve is a concrete way to visualize the wave. In the lesson about graph of simple harmonic motion, we ended up with the following graph.

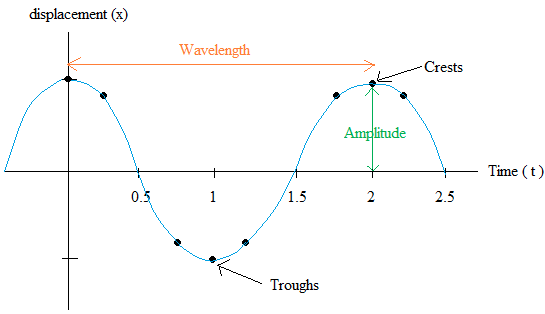
Below, we add a little piece to the graph and some wave terms.

The troughs are the low points of the graph. In our case, it will just be
-10 cm, -10 cm, ...,
The crests are the high points of the graph. In our case, it will just be
10 cm, 10 cm, ...,
The amplitude is the maximum displacement from the equilibrium point or mean position. In the lesson about graph of a simple harmonic motion, we saw that the mean position is x = 0.
In the first graph above, the maximum displacement is 10 cm.
10 cm - 0 cm = 10 cm.
The amplitude is 10 cm
The wavelength is the distance from the top of one crest to the next one.
It does not have to be measured from the top of adjacent crests
It can be measured from adjacent troughs as well or any successive identical parts of the wave. For example, you could measure the wavelength on the time axis from 0.5 to 2.5.