What is exponential decay?
What is exponential decay? Whenever a quantity decreases or shrinks rapidly as a result of a constant rate of decay applied to it, that quantity is experiencing exponential decay.
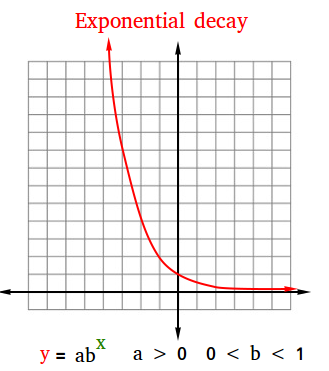
The figure below is an example of exponential decay. In fact, it is the graph of the exponential function y = 0.5x
The general form of an exponential function is y = abx. Therefore, when y = 0.5x, a = 1 and b = 0.5.

The following table shows some points that you could have used to graph this exponential decay. Try to locate some of these points on the graph!
| x | 2x | y |
| 1 | 0.51 | 0.5 |
| 2 | 0.52 | 0.25 |
| 3 | 0.53 | 0.125 |
| 0 | 0.50 | 1 |
| -1 | 0.5-1 | 1/0.5 = 2 |
| -2 | 0.5-2 | 1/0.25 = 4 |
| -3 | 0.5-3 | 1/0.125 = 8 |
What is exponential decay in real-life?
There are many real-life examples of exponential decay. Just to mention a few, here are some real-world applications of exponential decay.
- Population decay
- Radioactive decay
- Bacterial decay
- Depreciated value of a car
Population decay
For example, suppose that the population of a city was 100,000 in 1980. Then every year after that, the population has decreased by 3% as a result of heavy pollution. This is an example of exponential decay.
Notice that the rate of decay is 3% or 0.03 and it is constant. This is important since the rate of decay cannot change.
Let us find the exponential function.
Year 1981 or 1 year after:
100,000 - 100,000 x 0.03 = 100,000 (1 - 0.03)
100,000 - 100,000 x 0.03 = 100,000(0.97)
100,000 - 100,000 x 0.03 = 100,000(0.97)1
Year 1982 or 2 years after:
100,000(0.97) - 100,000(0.97) x 0.03 = 100,000(0.97) [1 - 0.03]
100,000(0.97) - 100,000(0.97) x 0.03 = 100,000(0.97)(0.97)
100,000(0.97) - 100,000(0.97) x 0.03 = 100,000(0.97)2
Following this pattern, suppose that
- x is the number of years since 1980
- 100,000 is the starting amount
- 0.97 is the rate or decay factor
Then y = 100,000(0.97)x
Comparing this exponential function with y = abx, we see that a = 100,000 and b = 0.97.
Exponential decay formula or general rule for modeling the exponential decay of a quantity
General rule for modeling exponential decay
Exponential decay can be modeled with the function
y = abx for a > 0 and 0 < b < 1
y = abx
x is the exponent
a is the starting amount when x = 0
b is the base, rate, or decay factor and it is a constant and it is smaller than 1.
Radioactive decay
The half-life of a particular radioactive material is the time it takes for half of the material to decay or cease to be radioactive. For example, the half-life of carbon-14 is 5730 years. In other words, it takes 5730 years for half of an amount of carbon-14 to cease to be radioactive.
Here are a few more examples.
- The half-life of radioactive gold-198 is 2.67 days.
- The half-life of bismuth-210 is 5 days.
- The half-life of iodine-123 is 13.2 hours.
In this section, we are going to use the half-life decay model shown below:
y = a(0.5)x/h
x/h is the exponent
y is the amount at time x
a is the initial amount at time t = 0
h = half-life
b = 0.5
b is also the base, rate, or decay factor and it is a constant and it is smaller than 1.
Notice that when x = h, y = a(0.5)1 = a/2
Radioactive gallium-67 is used quite often in medicine to diagnose malignant tumors. gallium-67 has a half-life of 46.5 hours. If 75 milligrams (mg) of gallium-67 is given to a patient, how many milligrams will be left in the patient after 1 week?
y = a(0.5)x/h
a = 75
h = 46.5 hours
x = 7 days = 7(24 hours) = 168 hours
y = 75(0.5)168/46.5
y = 75(0.5)3.61290323
y = 75(0.08173494154)
y = 6.13012061554
A little more than 6 milligrams of gallium-67 will be left in the patient after 1 week.
Bacterial decay
For example, suppose that the population of bacteria in a colony is decreased by 75% every day. How many bacteria will the colony have after 6 days if the starting amount is 600000.
y = a(0.25)x
x is equal to 6
y is the amount after 6 days
a is 600000
b is the decay constant and it is equal to 100% - 75% = 25% = 0.25
y = 600000(0.25)6
y = 600000(0.00024414062)
y = 146.484375
The number of bacteria left in the colony is 146 after 6 days.
Depreciated value of a car
The value of a new car is 78560 dollars. Suppose the car depreciates at a rate of 15% each year. What is the value of the car after 10 years?
y = a(0.85)x
x is equal to 10 years
y is the value of the car after 10 years
a is 78560
b is the decay constant and it is equal to 100% - 15% = 85% = 0.85
y = 78560(0.85)10
y = 78560(0.19687440434)
y = 15466.453205
After 10 years, the car will be worth approximately 15466 dollars.